OIL PROCEDURE FILES
GOLD PROCEDURE FILES

In the world of investment, understanding the interconnectedness of commodity prices is essential. Gold and oil, two of the most widely traded commodities, often serve as indicators for the overall health of the global economy. The fluctuations in their prices can provide valuable insights into the macroeconomic factors at play. As investment professionals, recognizing the correlations between gold and oil prices and how they are impacted by interest rates, exchange rates, growth, and inflation is crucial for making informed decisions in the market. By delving into these relationships, we can better navigate the complexities of commodity markets and maximize investment opportunities.
Petroleum and gold are strategic commodities crucial for global economic stability; hence, any changes in their prices have widespread effects.
Petroleum is a significant energy source that holds financial and political sway and impacts the world economy on many levels. Serving as the backbone of modern industry, petroleum plays a vital role in sectors like transportation, energy production, manufacturing, and agriculture. Since petroleum is a primary input for many industries, an increase in oil prices often negatively affects economic growth. Petroleum prices fluctuate continuously due to factors such as geopolitical tensions, production disruptions, and weather conditions. The Organization of the Petroleum Exporting Countries (OPEC) primarily determines oil prices through its production decisions. OPEC’s decisions regarding oil production can cause significant fluctuations in the market. Additionally, policies related to oil production in countries outside of OPEC, such as the United States, Canada, and Russia, also affect oil prices.
The Safe Haven Role of Gold
Gold, the most traded precious metal with various historical uses, has always been considered a safe haven during crises, revered as a secure refuge by investors in times of turmoil. With attributes of both a valuable metal and a monetary asset, gold prices fluctuate due to various factors such as the value of the dollar, geopolitical risks, inflation concerns, and global financial instability. Central banks often hold gold in their reserves, which is a significant factor influencing the value of gold. Economic growth contributes to increased demand for gold, while periods of stagnation cause fluctuations in gold prices due to the market’s tendency to avoid risks.
Especially during periods of increased geopolitical risks and market stress, it’s essential to note that gold doesn’t react uniformly to every uncertainty and crisis in the short term. This effect can vary depending on the type, magnitude, and global economic conditions of the event. Understanding how geopolitical events can affect gold prices can help investors build a more resilient portfolio against future uncertainties. The fundamental reasons for gold prices responding positively to geopolitical tensions are its absence of default risk, its value-preserving nature, and its generally inverse relationship with the US dollar. It’s important to note that although gold is referred to as a safe haven, it doesn’t promise constant and unlimited gains.
The Relationship Between Gold and Oil and Inflation
Gold and oil are strongly linked because they are both priced in US dollars. Although the relationship between gold and oil prices is complex and multifaceted, inflation plays a significant role at its core. An increase in oil prices raises fuel prices and indirectly affects the prices of all goods and services, thereby increasing inflation. Sudden increases in oil prices can hinder economic growth since many industries depend on fuel and its derivatives.
An increase in oil prices also affects gold prices in the same direction. High oil prices may raise inflation concerns and lead investors to assets that can hedge against inflation. In this case, traditional safe-haven assets like gold become attractive to investors.
Gold-Oil Ratio and Crisis Periods
Simply put, the Gold-Oil Ratio measures the relative value of gold and crude oil. Essentially, it’s a calculation anyone can make to determine how many barrels of oil can be bought with one ounce of gold or vice versa.
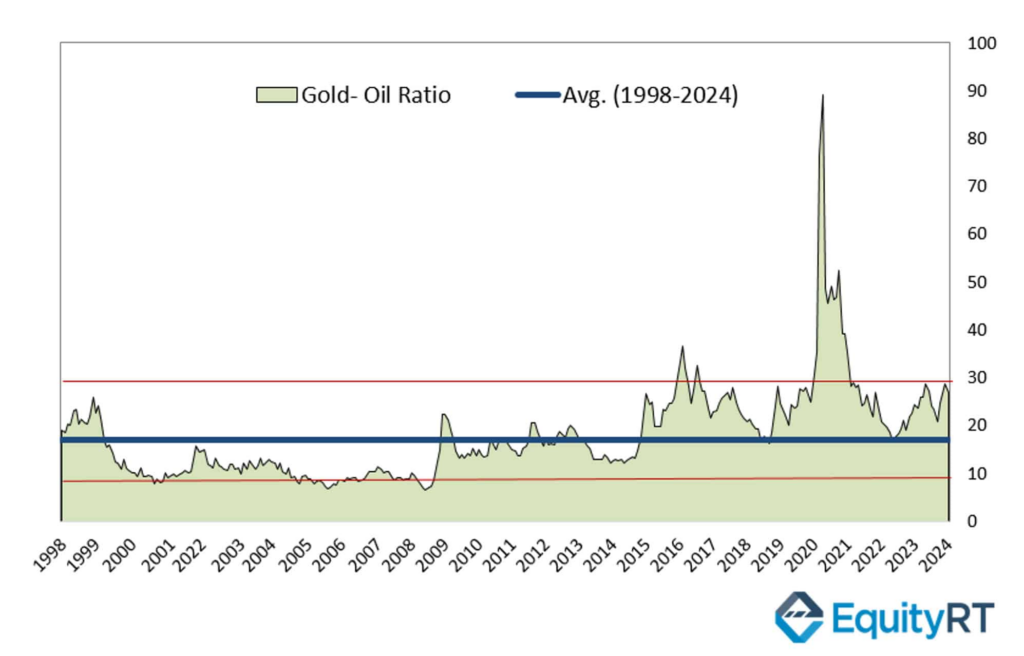
When oil prices fall and gold prices rise, indicating an above-average Gold-Oil Ratio, it may signal an impending economic downturn. In the long-term average, the Gold-Oil Ratio stands at 18:1, usually fluctuating between 10 and 30.
Over the past 20 years, several significant events have influenced the Gold-Oil Ratio. During the 2008 financial crisis, investors seeking safe haven assets increased demand for gold, leading to the ratio reaching its highest level since 1998. Similarly, during the 2014 collapse in oil prices due to oversupply and weak demand for crude oil, investors turned back to gold as they moved away from risky investments. This trend repeated in 2016.
Looking at the graph, during the COVID-19 turmoil (2019-2022) when financial markets were in turmoil, we see a sudden increase in the ratio to around 89.2. It’s an indicator that investors flocked to gold during that period of perceived stagnation. Excluding this period, the ratio is seen to be close to the norm of 30:1.
The current ratio of 28.9 indicates that gold is “relatively” valuable compared to oil prices. Rising energy prices, increased geopolitical tensions, and ongoing conflicts such as between Russia and Ukraine contribute to this. However, despite OPEC not planning a decrease in supply, expectations of strong economic growth in the US and other countries are boosting demand for oil, thus driving oil prices upward.

Can Changes in Commodity Prices Affect the Federal Reserve’s (Fed) Interest Rate Policies?
The answer to the question depends on the impact of changes in commodity prices on inflation levels. Despite higher-than-expected US inflation data at the beginning of the year, it did not alter the overall picture. Therefore, markets have been pricing in the possibility of the Fed cutting interest rates in the coming months until mid-April. This expectation parallels the increasing interest in gold from various central banks, as highlighted by the World Gold Council. In recent months, many central banks have raised their gold reserves to record levels.
The direction of commodity prices can potentially influence the Federal Reserve’s (Fed) interest rate policies, particularly considering their impact on inflation levels. While higher commodity prices may contribute to inflationary pressures, the response of central banks, including the Fed, remains a critical factor in shaping future monetary policies.
Recent remarks from Chairman Powell on interest rate adjustments have added a new layer of uncertainty. While delayed rate cuts might typically dampen gold’s appeal, other significant factors such as central bank actions and geopolitical concerns currently outweigh this influence.

Classification
Oil is classified according to three main categories: the geographic location where it was drilled, its sulfur content, and its API gravity (a measure of density).
Classification: Geography
Oil is drilled all over the world. However, there are three primary sources of crude oil that set reference points for ranking and pricing other oil supplies: Brent Crude, West Texas Intermediate, and Dubai and Oman.
Brent Crude is a mixture that comes from 15 different oil fields between Scotland and Norway in the North Sea. These fields supply oil to most of Europe.
West Texas Intermediate (WTI) is a lighter oil that is produced mostly in the U.S. state of Texas. It is “sweet” and “light”—considered very high quality. WTI supplies much of North America with oil.
Dubai crude, also known as Fateh or Dubai-Oman crude, is a light, sour oil that is produced in Dubai, part of the United Arab Emirates. The nearby country of Oman has recently begun producing oil. Dubai and Oman crudes are used as a reference point for pricing Persian Gulf oils that are mostly exported to Asia.
The OPEC Reference Basket is another important oil source. OPEC is the Organization of Petroleum Exporting Countries. The OPEC Reference Basket is the average price of petroleum from OPEC’s 12 member countries: Algeria, Angola, Ecuador, Iran, Iraq, Kuwait, Libya, Nigeria, Qatar, Saudi Arabia, the United Arab Emirates, and Venezuela.
Classification: Sulfur Content
Sulfur is considered an “impurity” in petroleum. Sulfur in crude oil can corrode metal in the refining process and contribute to air pollution. Petroleum with more than 0.5 percent sulfur is called “sour,” while petroleum with less than 0.5 percent sulfur is “sweet.”
Sweet oil is usually much more valuable than sour because it does not require as much refining and is less harmful to the environment.
Classification: API Gravity
The American Petroleum Institute (API) is a trade association for businesses in the oil and natural gas industries. The API has established accepted systems of standards for a variety of oil- and gas-related products, such as gauges, pumps, and drilling machinery. The API has also established several units of measurement. The “API unit,” for instance, measures gamma radiation in a borehole (a shaft drilled into the ground).
API gravity is a measure of the density of petroleum liquid compared to water. If a petroleum liquid’s API gravity is greater than 10, it is “light,” and floats on top of water. If the API gravity is less than 10, it is “heavy,” and sinks in water.
Light oils are preferred because they have a higher yield of hydrocarbons. Heavier oils have greater concentrations of metals and sulfur, and require more refining.
Petroleum Reservoirs
Petroleum is found in underground pockets called reservoirs. Deep beneath the Earth, pressure is extremely high. Petroleum slowly seeps out toward the surface, where there is lower pressure. It continues this movement from high to low pressure until it encounters a layer of rock that is impermeable. The petroleum then collects in reservoirs, which can be several hundred meters below the surface of Earth.
Petroleum can be contained by structural traps, which are formed when massive layers of rock are bent or faulted (broken) from Earth’s shifting landmasses. Oil can also be contained by stratigraphic traps. Different strata, or layers of rock, can have different amounts of porosity. Crude oil migrates easily through a layer of sandstone, for instance, but would be trapped beneath a layer of shale.
Geologists, chemists, and engineers look for geological structures that typically trap petroleum. They use a process called “seismic reflection” to locate underground rock structures that might have trapped crude oil. During the process, a small explosion is set off. Sound waves travel underground, bounce off of the different types of rock, and return to the surface. Sensors on the ground interpret the returning sound waves to determine the underground geological layout and possibility of a petroleum reservoir.
The amount of petroleum in a reservoir is measured in barrels or tons. An oil barrel is about 42 gallons. This measurement is usually used by oil producers in the United States. Oil producers in Europe and Asia tend to measure in metric tons. There are about six to eight barrels of oil in a metric ton. The conversion is imprecise because different varieties of oil weigh different amounts, depending on the amount of impurities.
Crude oil is frequently found in reservoirs along with natural gas. In the past, natural gas was either burned or allowed to escape into the atmosphere. Now, technology has been developed to capture the natural gas and either reinject it into the well or compress it into liquid natural gas (LNG). LNG is easily transportable and has versatile uses.
